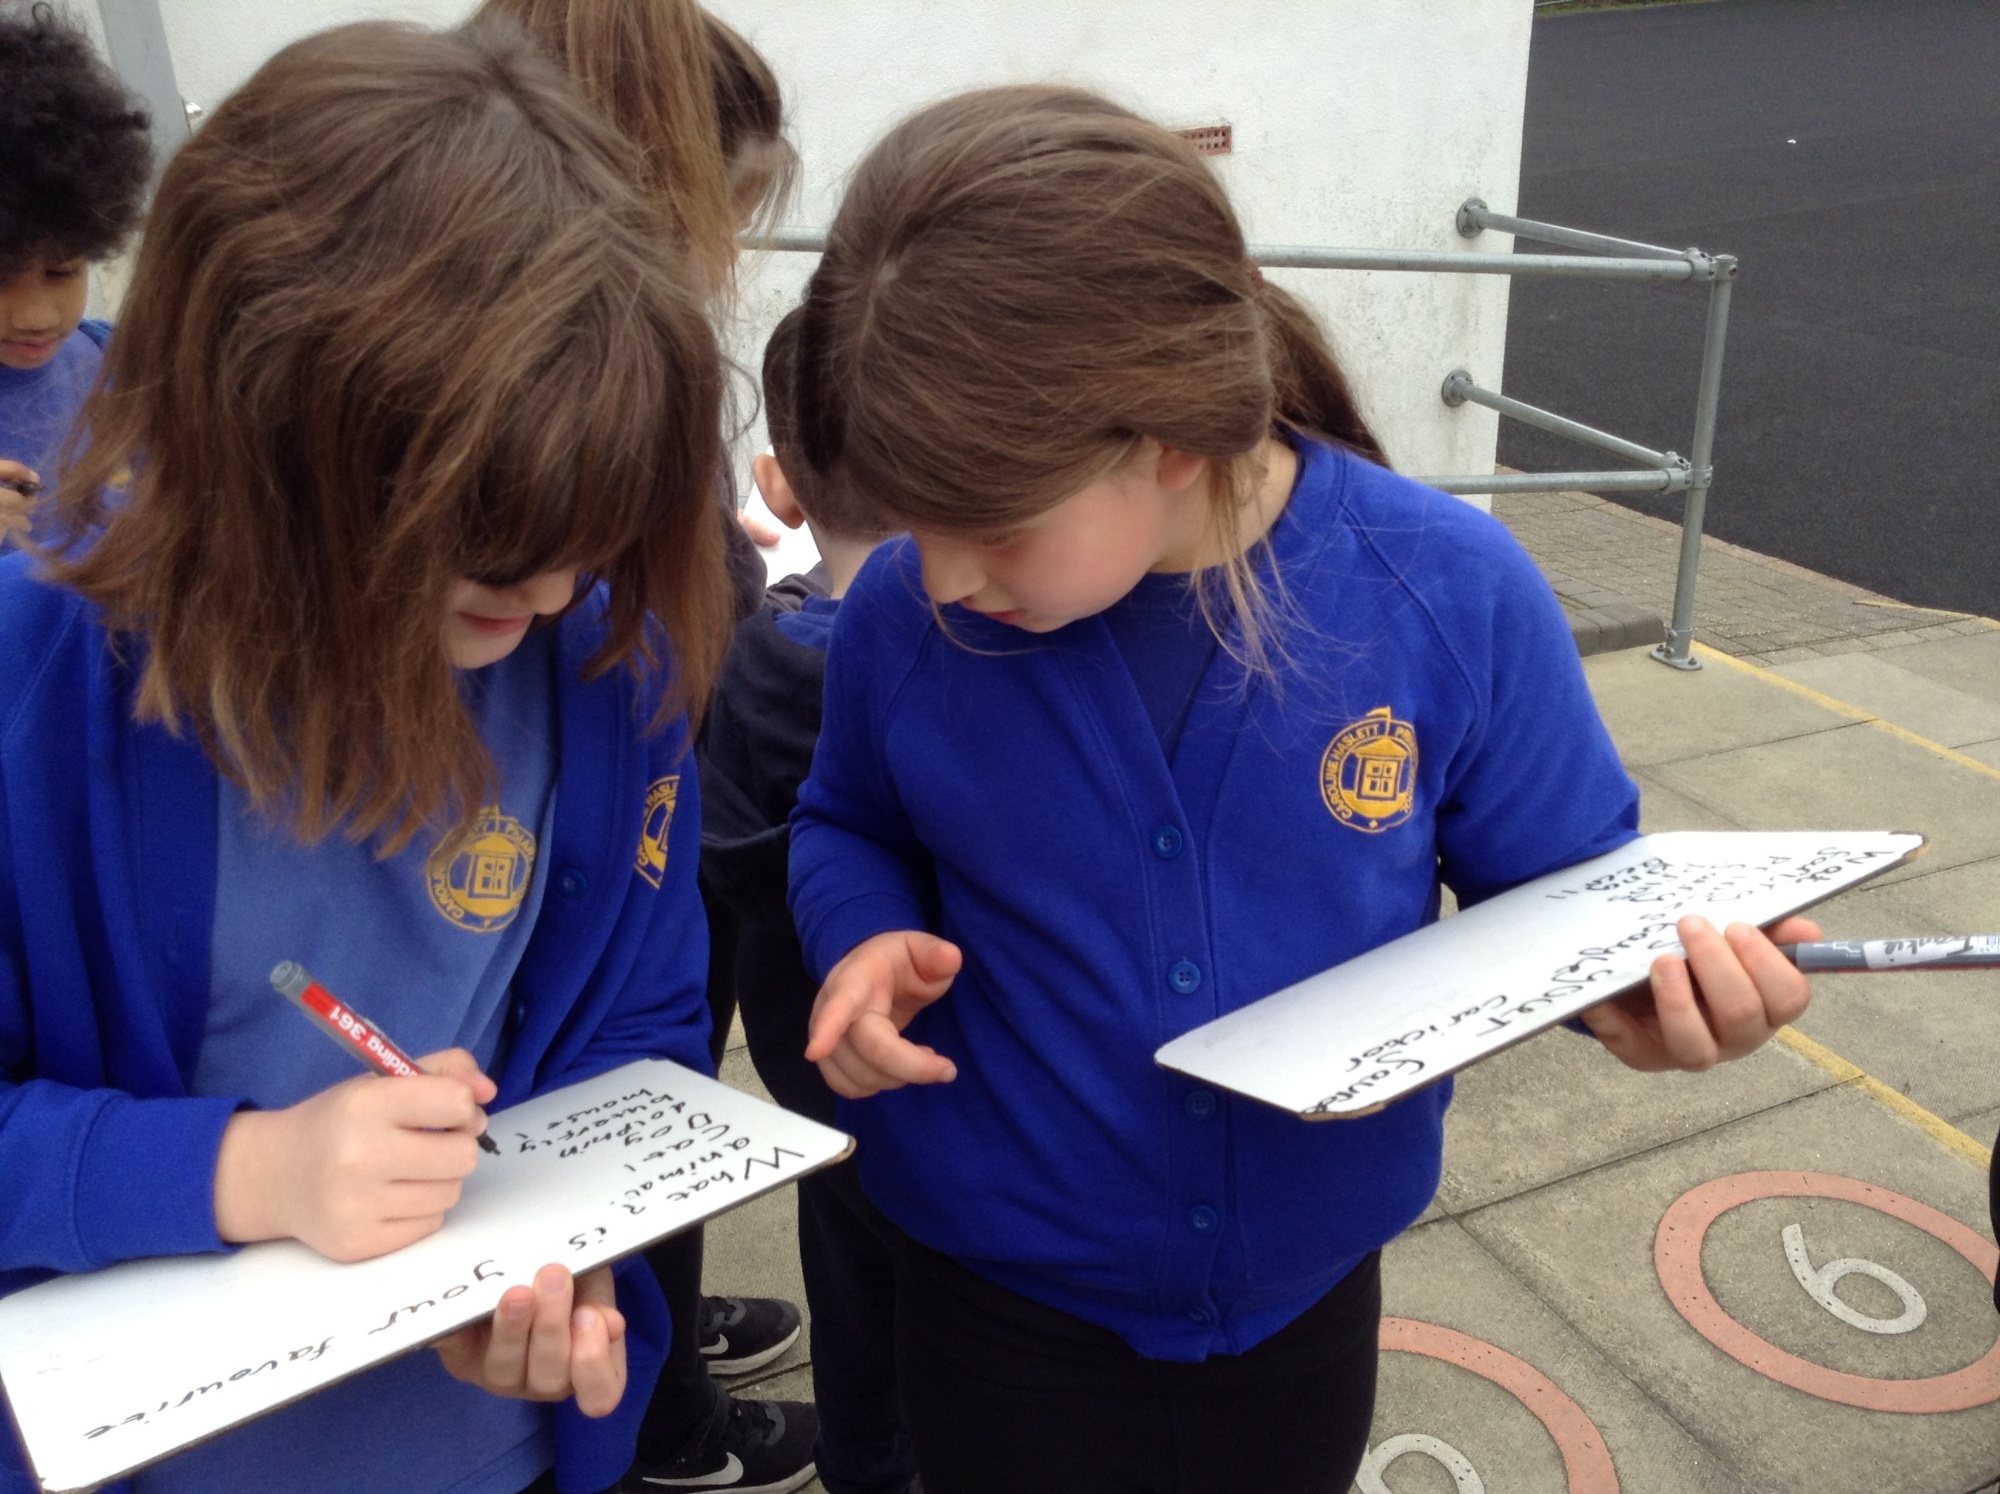
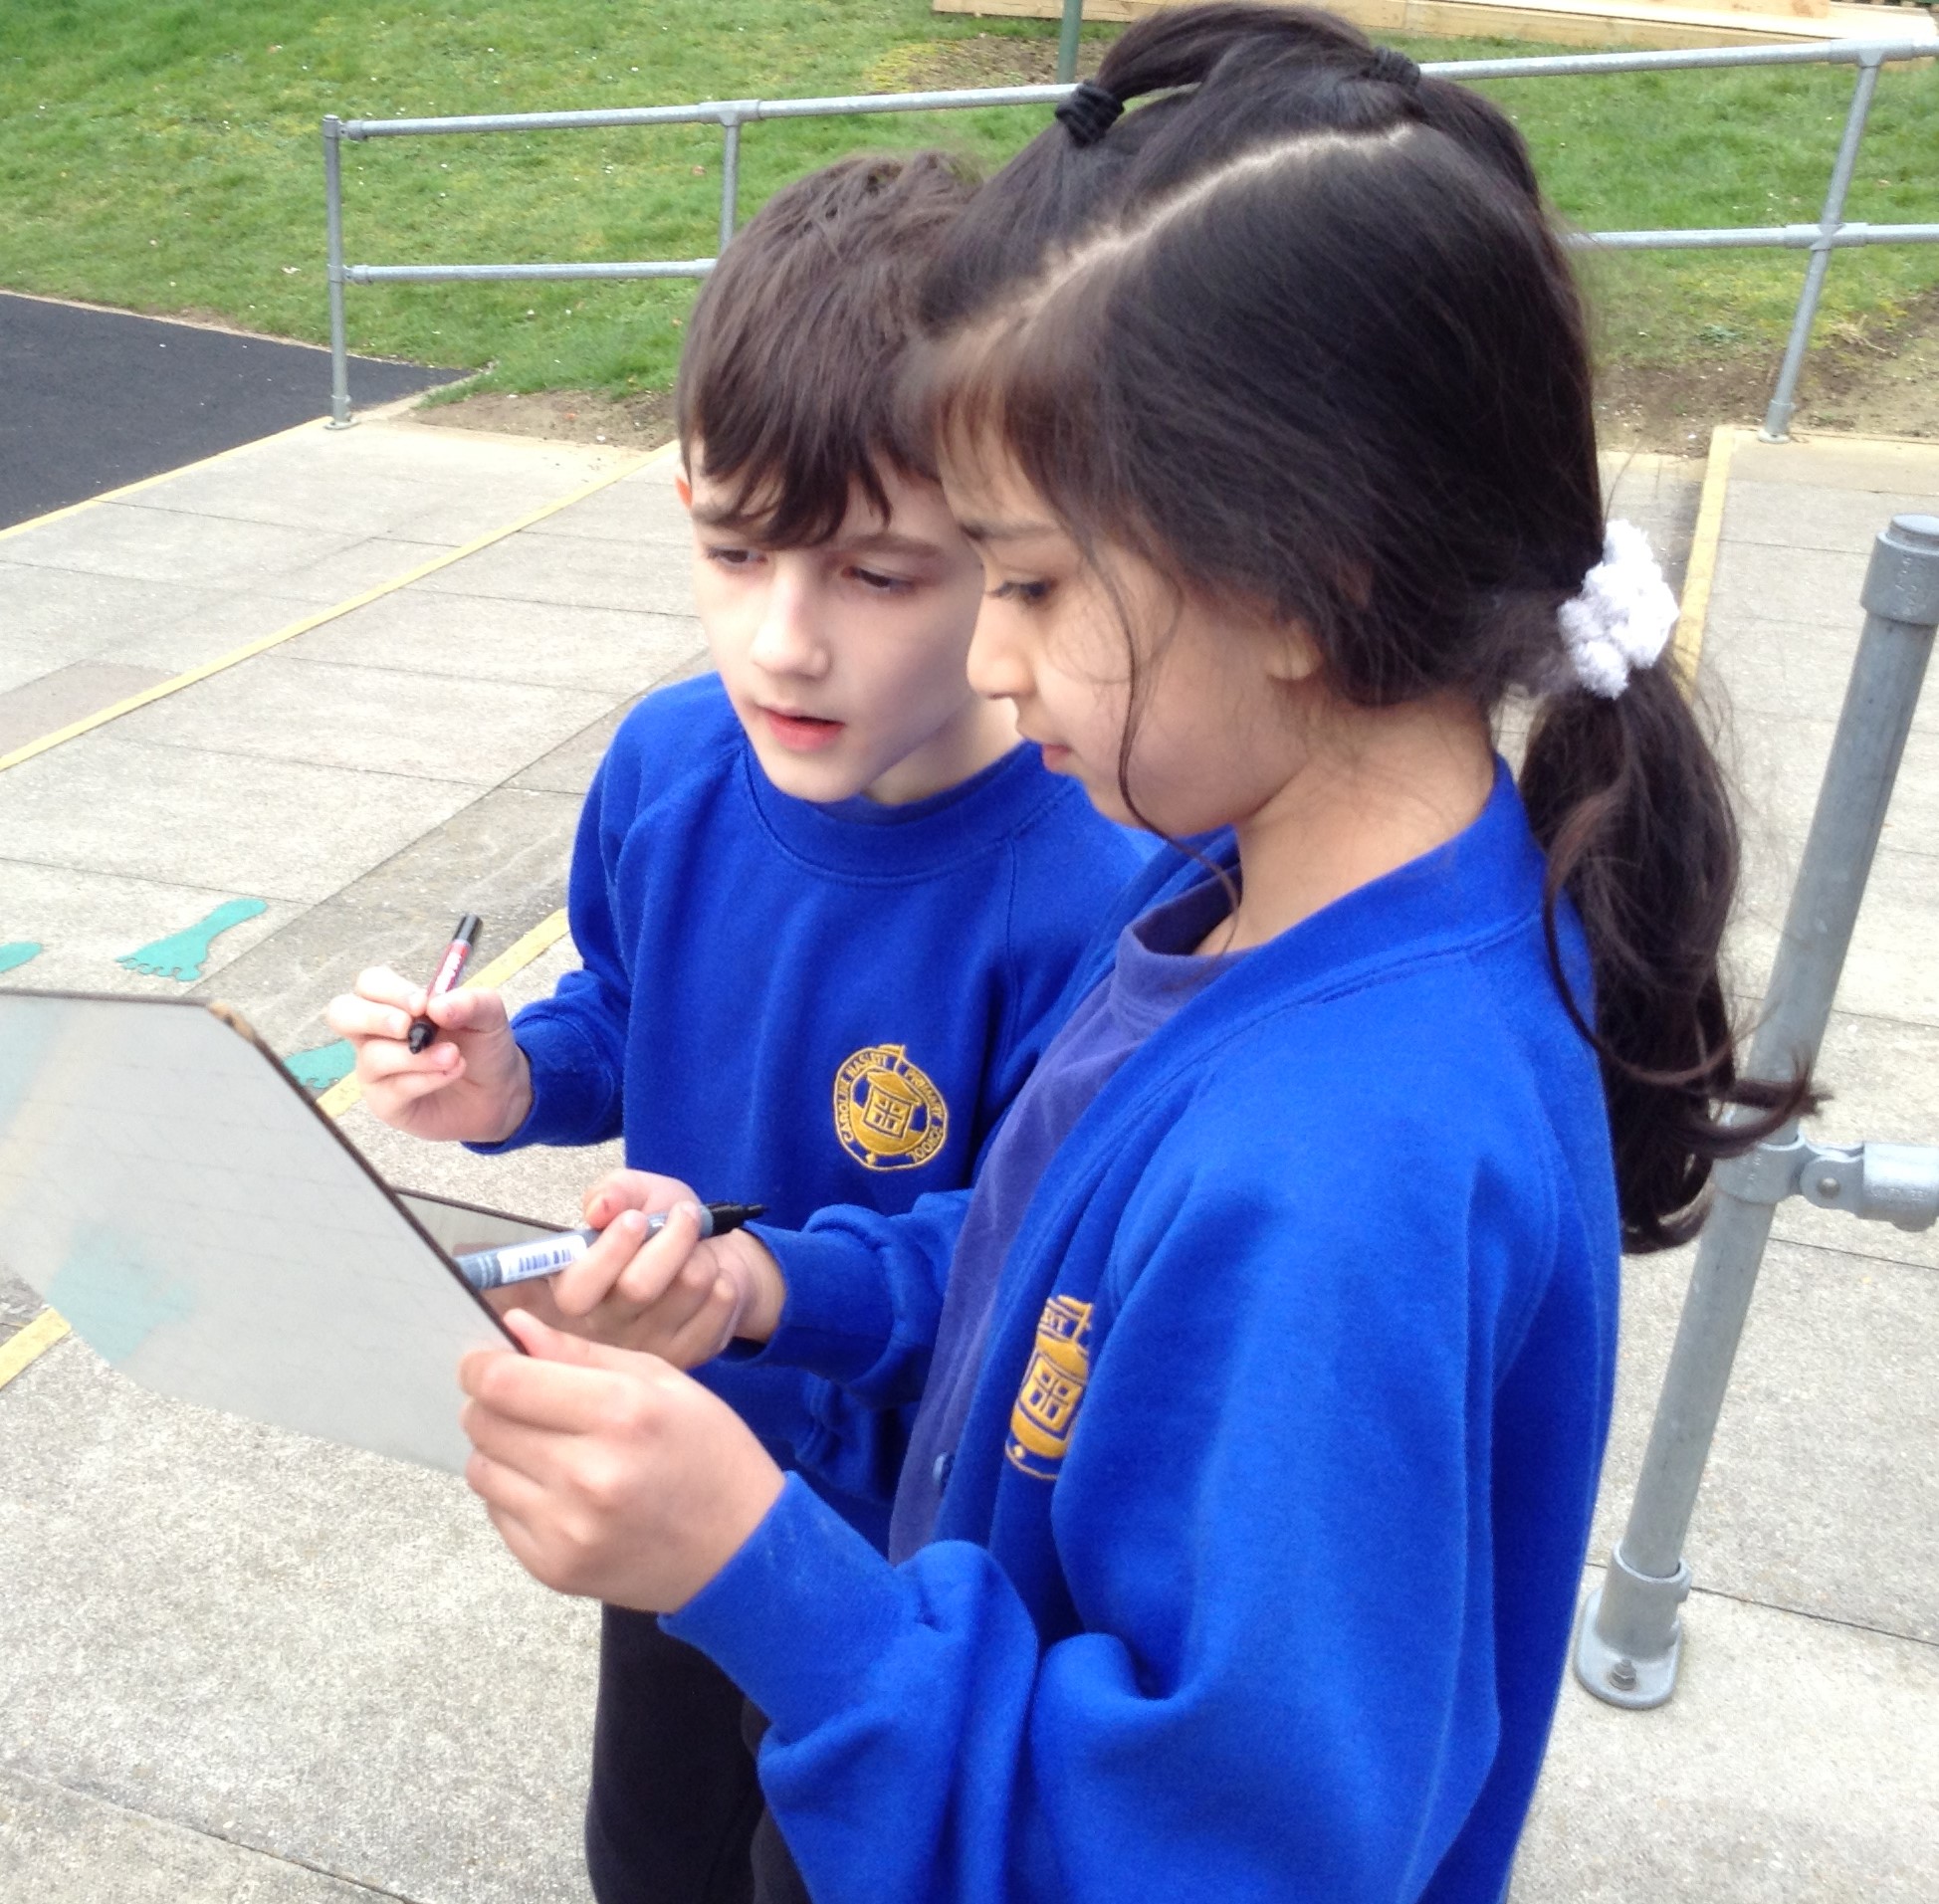
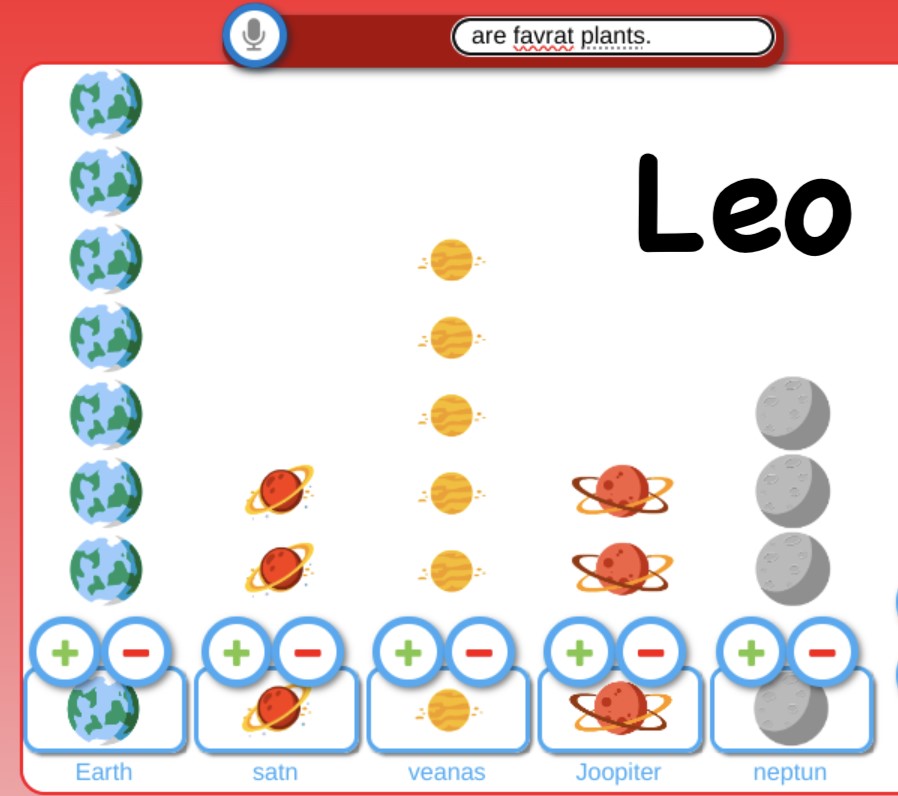
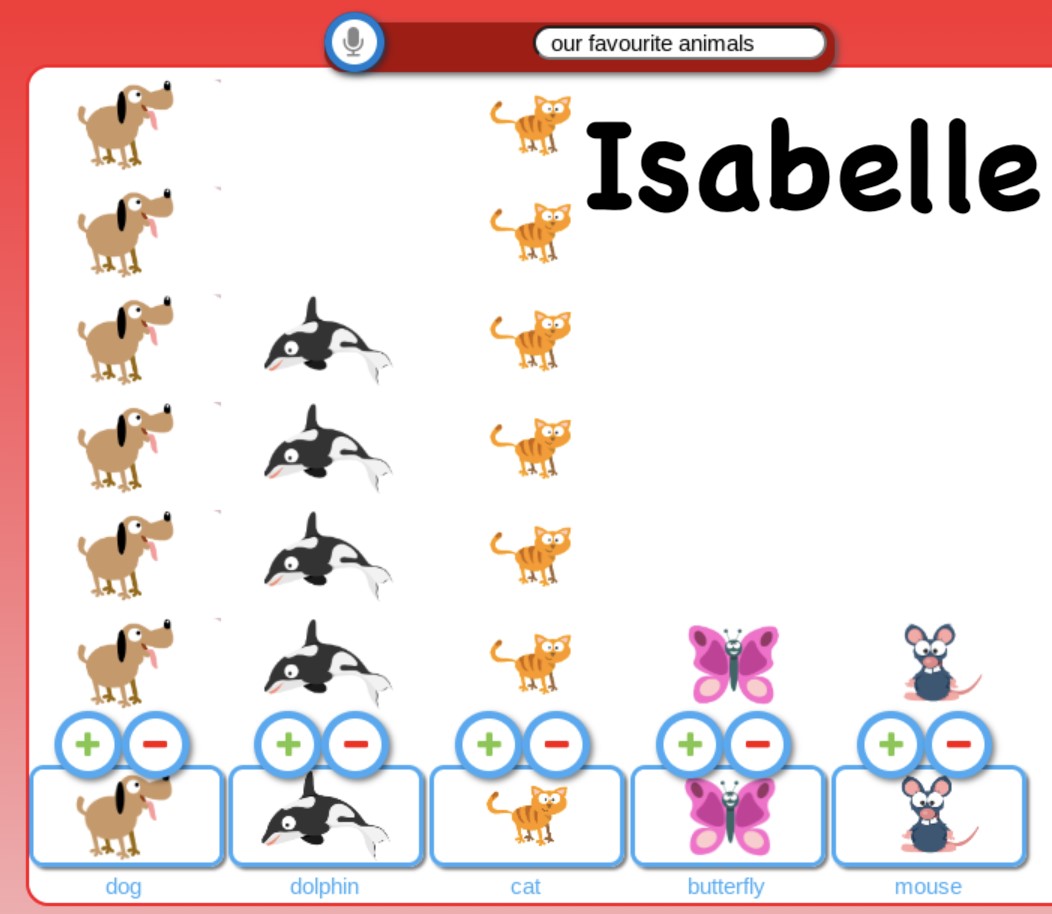
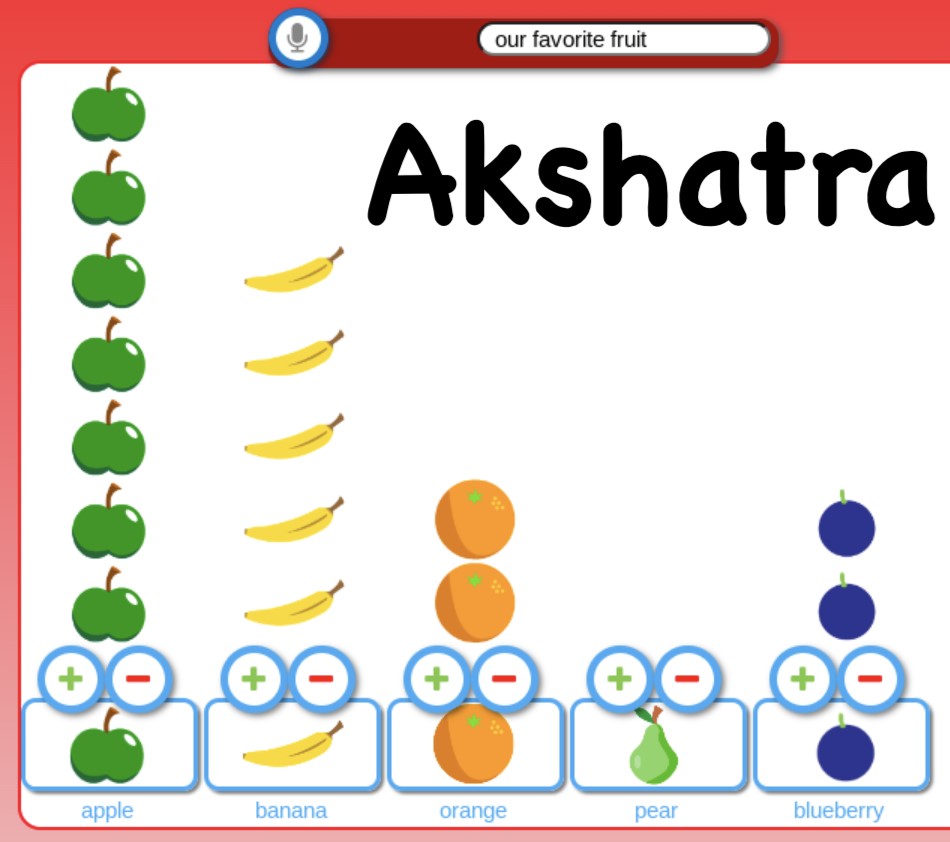
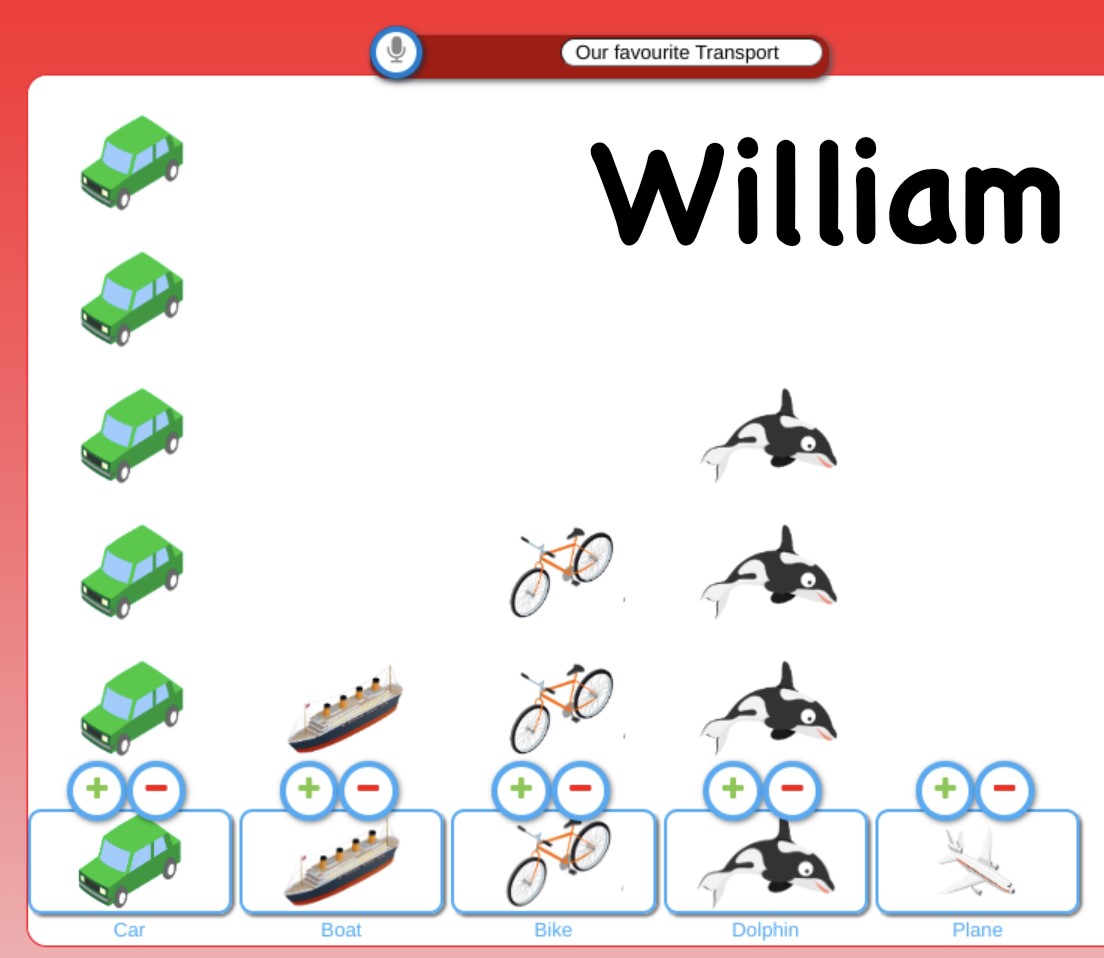
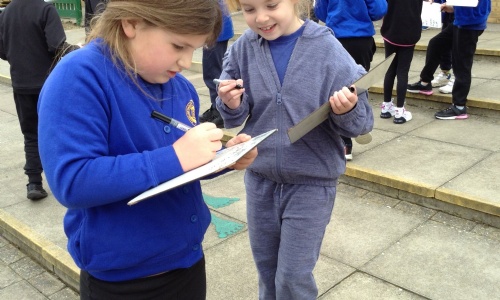
Year 2 has been exploring what data means and how it can be collected in the form of a tally chart. The children have learnt the term ‘attribute’ and they used this to help them organise data. We collected data and presented it in the form of pictograms.
![](/_site/data/files/images/news-pics/7F3CA37ADA6E35507D0CA9389FB2D365.jpeg)
![](/_site/data/files/images/news-pics/DB79284A14D7ADA6F2070D61A8330810.jpeg)
![](/_site/data/files/images/news-pics/C6B104AECF9E7723C15EF29965EE1E10.jpeg)
![](/_site/data/files/images/news-pics/D92182CE419C4E1137B64A570D67B02D.jpeg)
![](/_site/data/files/images/news-pics/A9292CAC6D3DCE8B9FA5D7B3B772CCD6.jpeg)
![](/_site/data/files/images/news-pics/F1DD53DD32894844CC5F521F7DB9AD67.jpeg)